Sander de Haas of SamSamWater hosted a workshop titled ‘Vergroen je project – Praktische oplossingen voor water en vergroening’ (‘Regreen your project – Practical solutions for water and regreening’) at the Wilde Ganzen dag 2023.
The slides can be viewed here:
Sander de Haas
Google Earth Outreach team hosts a series of monthly lightning talks by and for nonprofits, scientists and other change-makers who want to leverage mapping tools and technology for positive impact in the world.
During the Geo for Good Lightning Talk on Crisis Response Sander de Haas presented on how SamSamWater uses remote sensing data to support humanitarian aid workers during crisis response efforts and refugee camp planning.
Watch Sander’s presentation here:
Or watch all lightning talks and the Q&A with the speakers here.
Dec 302020
We’ve updated the SamSamWater Climate Tool! The tool now uses improved and updated global datasets to display average monthly rainfall and evaporation data for any place on Earth.

Click here to visit the Climate Tool.
Oct 082020
Sander de Haas (SamSamWater and Justdiggit) and Hans van Luijk (Stipulae) will host a webinar on ‘Regreening in a changing climate’ for the Wilde Ganzen – Partin maand.
The webinar will start at Friday 9 October 2020 at 14:00 CET. For more information and registration see the website of Wilde Ganzen – Partinmaand.
We will present a case study of a project by Stipulae and SamSamWater on regreening to improve water and food security for a Maasai community in Tanzania. During the webinar we will demonstrate practical examples to select the most appropriate interventions for other projects and NGOs.
The presentations will be in Dutch and the slides can be previewed here:
Hans’ slides on the on the project in Same, Tanzania.
Sander’s slides with practical tips to analyse, compare and select the most appropriate interventions on water and food security.
You can watch a recording of the webinar at the website of the Wilde Ganzen – Partin maand.
Sep 292019
Sander de Haas presented the work SamSamWater has been doing on refugee camps and crisis response mapping during the Google Geo for Good 2019 Summit.
Partner Panel presentation on Maps for crisis relief by Sander de Haas
During the summit they organised a a build-a-thon where particpiants from different organisations could build a project using mapping tools, collaboratively. Together with Christian Thomas & Brendan Jarrell of SkyTruth, Sander worked on a Map Toolbox for humanitarian aid workers. This Map Toolbox can support humanitarian aid workers in the planning and management of refugee camps and make information quickly available in crisis situations.
At the end of the summit a functional first version of the toolbox was presented and the team won the build-a-thon award for ‘Best Social Impact’! We are very proud of this!
This prototype shows the concept works very well, now we have to extend the toolbox to include more data sources and add extra functionality. We will use this prototype to find partners (both technical and funding) to bring this to the next level. If you are interested, please contact sanderdehaas@samsamwater.com.
In complex emergencies, information management is becoming increasingly important and a useful tool for assessment, planning of water and sanitation infrastructure and coordination.
DSS water, with the support of SamSamWater, is organizing a 2-day training on GIS and Google Earth on the 4th and 5th of September 2019.
The training is recommended for all water, sanitation and hygiene experts who consider being deployed by DSS water, or for professionals working within WASH in the emergency sector, with a basic working knowledge on GIS and Google Earth.

The first day of the training will provide a basic, general understanding of Google Earth in relation to WASH practices, and thereby addresses the basics of navigation, historical imagery and time series, map editing, georeferencing maps and importing excel files. The second day will continue on this knowledge, covering more advanced skills on geo tools and analysis for WASH projects, including exercises on mobile data collection and GPS measurements with smartphones. The training will use some of the practical experience of experts deployed as IM in emergencies.
The training is free of charge and will take place from 9:00 am till 16:30 pm at the Netherlands Red Cross office in the Hague (Anna van Saksenlaan 50).
Are you interested in broadening your knowledge and would you like to attend? Please register as soon as possible (deadline is July 31st), by sending a short motivation (max. 200 words) and CV to dsswater@rvo.nl.
We are very proud to officially launch Greener.LAND today at the 2019 Global Global Landscape Forum in Bonn.
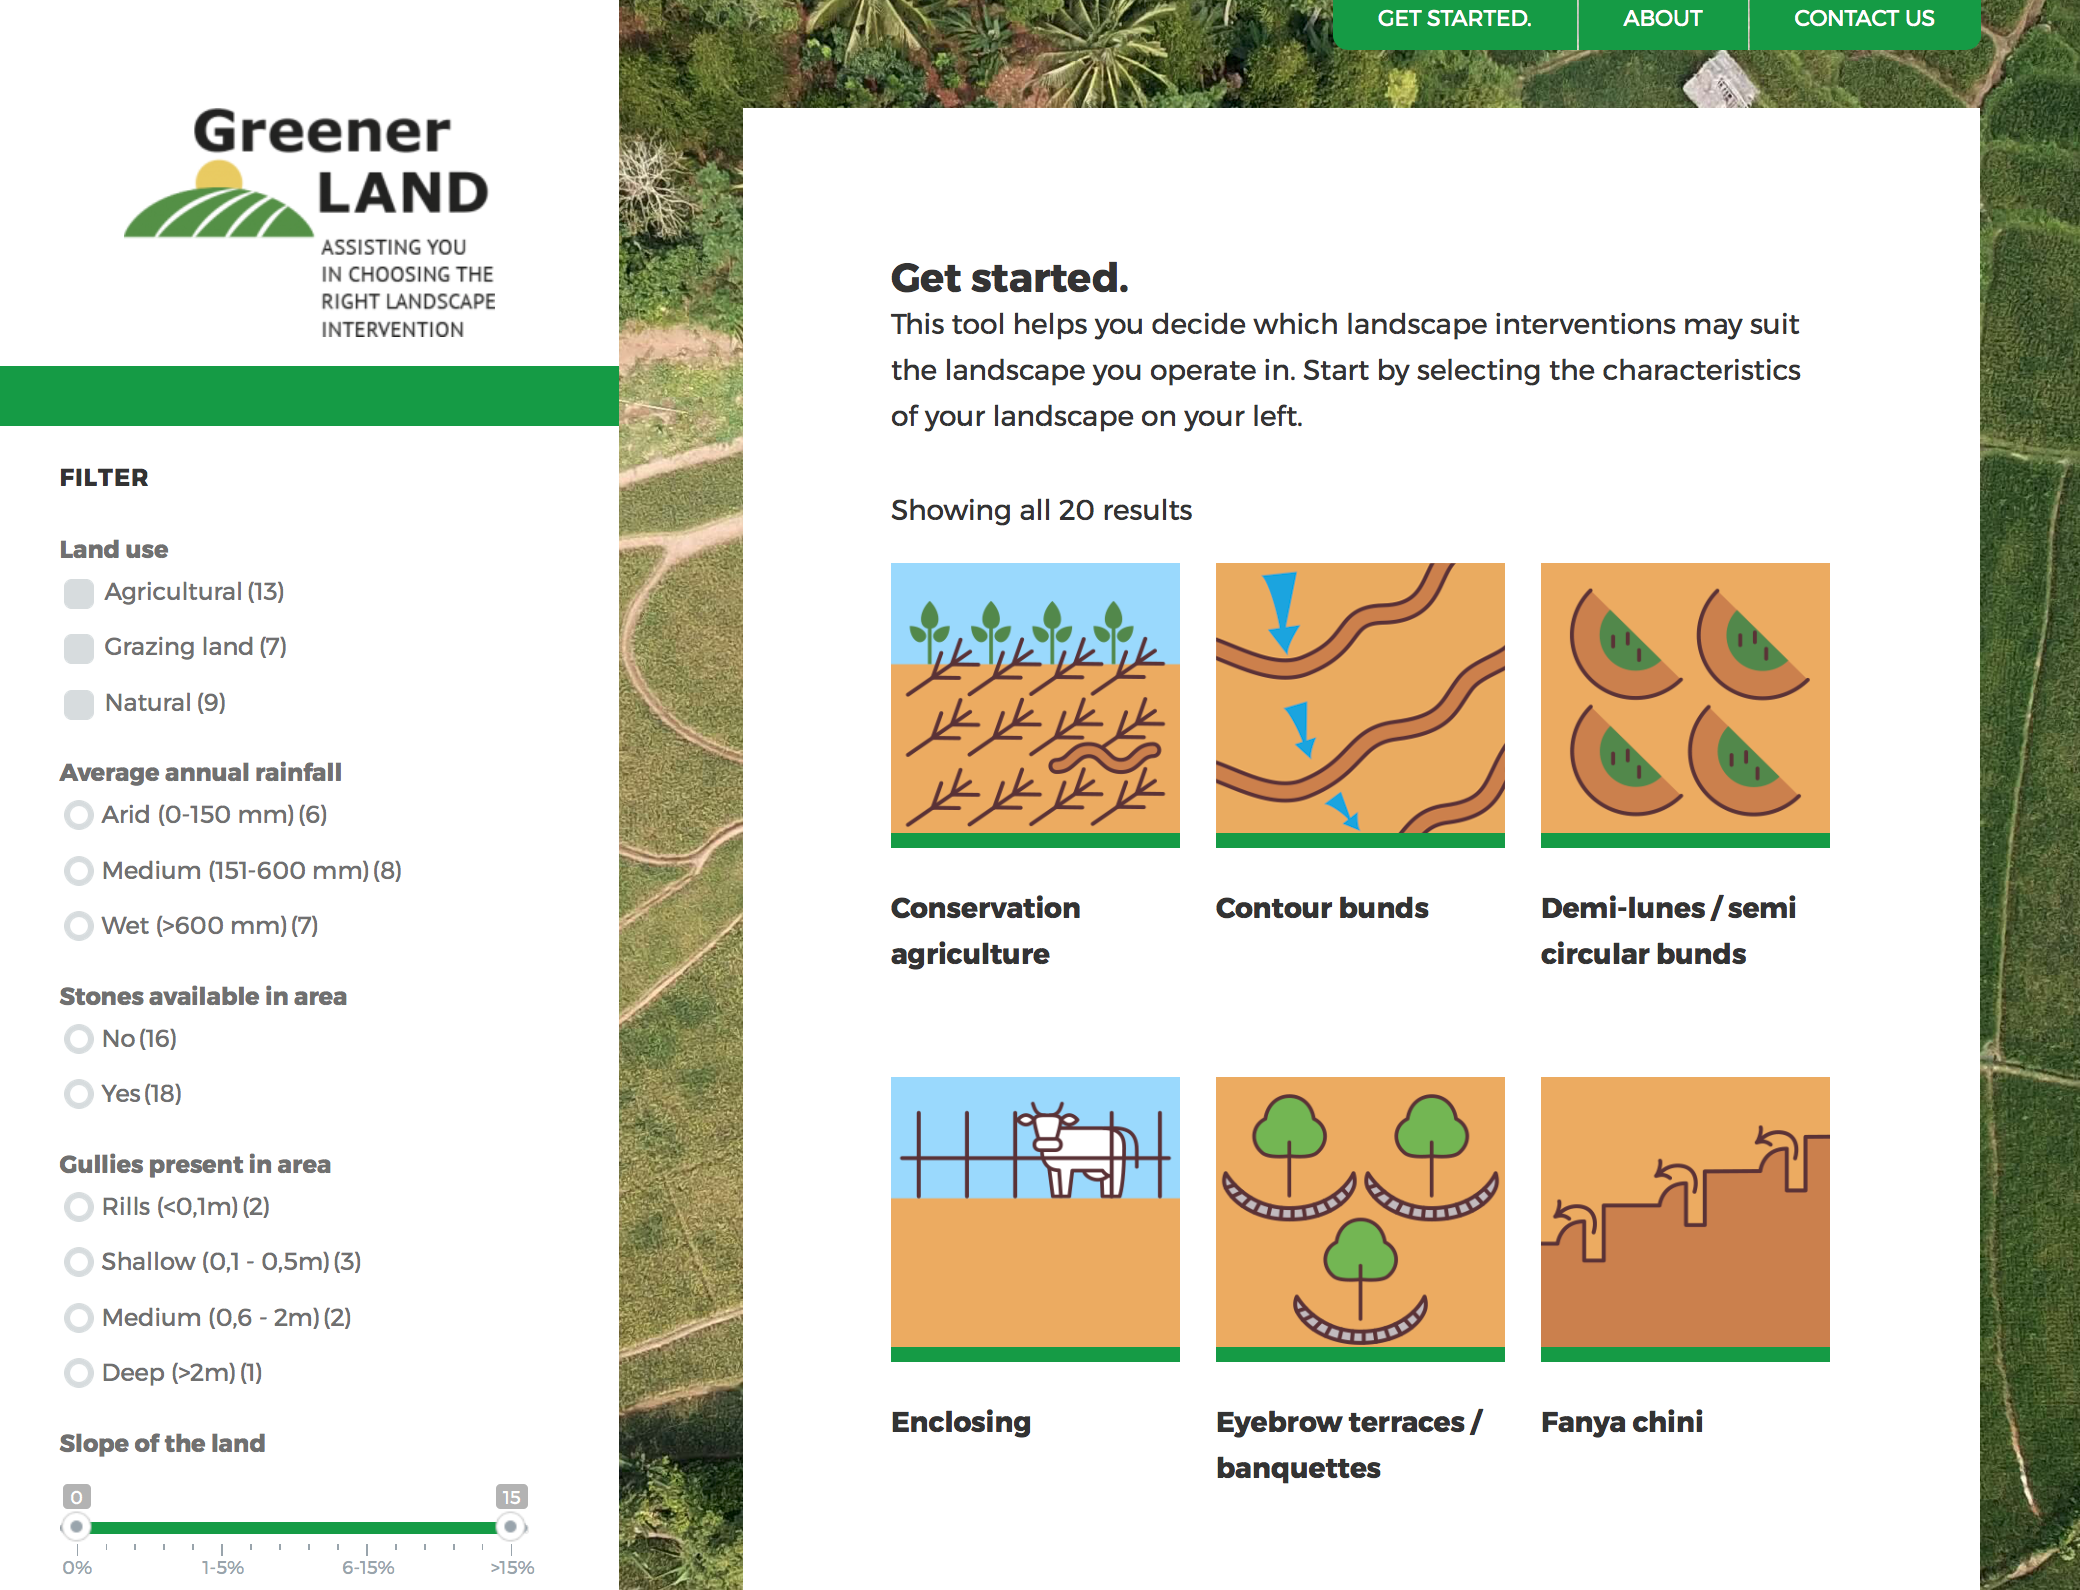
Greener.LAND is an easy-to-use, intuitive, free and open-access online tool to educate and assist landscape practitioners on restoring their landscapes. Greener.LAND has been developed as a collaboration between Nature^Squared and SamSamWater.
It has already been featured in an article and is part of the official program, at 12:30 at the Learning Cafe.
And for our LinkedIn audience, we provide a sneak preview: www.Greener.LAND. We are curious to hear what you think, so please provide us with feedback through our survey.
Mar 282019
After hearing about the devastating impact of cyclone Idai in Mozambique, Malawi and Zimbabwe, we thought it might be helpful to compile a map repository where maps and satellite data are from all different sources are combined.
We have combined topographic maps, elevation data, rivers, houses and many more in 1 online platform for easy viewing on both desktop and smartphones. The maps can be viewed here:
https://samsamwater.com/idai
If you navigate to the “Layers” tab you can toggle all the different layers.
There’s a range of maps from different sources. I’ve highlighted a few map types and possible uses below.
Topography
A detailed topographic map (left) compared to OpenStreetMap (right). The topographic map shows much more details including (unpaved) roads, swamps and small streams. The topographic map is old (made by the Soviet military in the 1980’s) so don’t rely on it for settlements, but landscape features (like wetlands) and roads are often still very accurate.


Hydrology
An easy overview of all watersheds (catchments), rivers and tributaries in the region and (in dark blue) the extent of the flooding:

Elevation
Left: Elevation map (only for elevations from 0 to 50 m above sea level for increased contrast)
Mid: Elevation map + flood extent map (derived from satellite imagery by ESA)
Right: Elevation + flood extent + buildings (mostly houses, derived from OpenStreetMap)


I’ve also added an elevation map in the platform for the full area (from 0 to 2500 m+MSL) which might come in handy for areas more upstream. And you can change the transparency of the individual layers using the sliders.
If you zoom in you can see that, luckily, most houses are constructed on the higher grounds, but maps like these could be used to identify priority areas such as where people might be trapped:

If you are working on something where maps like these could be helpful, please let me know and I can think along with you and see what data is available and how we can visualise that in the best manner.
Jun 062018
The program for the workshop in the use of GIS, Smart data collection and data visualization for WASH professionals can be found here: Program and info GIS tools for WASH workshop.
The location of the workshop is the new office of the Red Cross in The Hague close to NS station Laan van NOI:
Red Cross office, Anna van Saksenlaan, 2593 HT, The Hague
(this is a different location as communicated earlier!)
SamSamWater, DSS Water, Red Cross and 510 organise a workshop on the use of GIS, Smart data collection and data visualization for WASH professionals.
This practical ‘hands-on’ workshop will explore the possibilities of finding and using secondary data to understand local conditions in the field. You will learn how to digitally collect data, use mapping software, import field measurements (i.e. GPS measurements) and combine maps with field experiences. Mostly practical exercises and some theory will make up the workshop in order for WASH delegates to start using and collecting data in a standardised manner, for sustainability purposes.
Duration: 2 days
Date: 7-8 June
Maximum number of participants: 20
Organisers: DSS water with support of Red Cross, SamSamWater and 510
Location: Red Cross office, Anna van Saksenlaan, 2593 HT, The Hague
Are you interested to participate in the workshop? Please send an email before the 3rd of May 2018 to dsswater@rvo.nl
For more info on the full program, please follow this link:
Practical hands-on workshop for GIS and other digital tools for WASH
